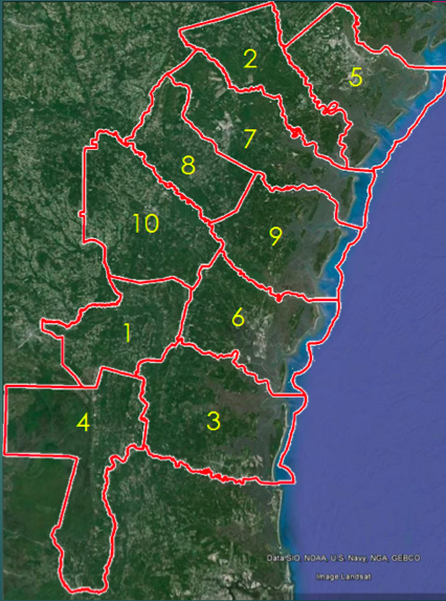
For my Senior Project, I focused on an area and concern of interest to me, the endangered species in Southeast Georgia and how severe weather could affect their habitat. Before any work could be done, a defined study area was to be established. This map here show the 10 county range in which I focused on the endangered species. The counties here are:
-Brantley County
-Bryan County
-Camden County
-Charlton County
-Chatham County
-Glynn County
-Liberty County
-Long County
-McIntosh County
-Wayne County
From here, a problem statement was to be written to have a focus on the endangered species within the study area. The Problem Statement was:
"Georgia has it’s fair share of Endangered Species. Based on natural causes of habitat loss and damage, Southeast Georgia is at a much higher risk of endangered species loss due to the likeliness of severe weather, particularly hurricanes. Though Georgia has been lucky to avoid many major storms, the threat is still eminent. If a major storm were to hit, what would be done about the endangered species within the area? Back in 1989, Hurricane Hugo nearly wiped out a species of Red Cocked Woodpeckers in South Carolina because of severe loss of habitat from the storms damage. Many species can’t afford a loss of habitat from storm damage. If existing Conservation Area within Southeast Georgia were expanded, there would be more habitat for the species in the event of a severe storm".
From here, data was collected in regards to the endangered species, past weather data and study area.
Present Conditions
- The first image is of the Eastern Indigo Snake, one of the endangered species of the area. The Eastern Indigo Snake was recognized as endangered in 1978 under the Endangered Species Act. A nonvenomous snake, the Eastern Indigo is considered the longest native snake species in the US. Today, it is illegal to even capture or possess one without a special permit.
- The next image is of the Shortnose Sturgeon, the only fish endangered in the area. Since 1967 the Shortnose Sturgeon has been recognized as endangered. In North America, they range from the Saint John River in New Brunswick to the St. Johns River in Florida, yet in Georgia their numbers are dwindling.
- The third image is of a Woodstork, the last of the animals endangered in the area. The Woodstork was placed on the endangered list in August of 2013 making it a newly endangered species. The Woodstork is currently the only species of stork that presently breeds in North America. Many nesting sites lie along Georgia's coast and within the study area.
- Image four is the first map showing present conditions of the ranges of the three species inside the study area. The Eastern Indigo Snake is shown in Red, the Shortnose Sturgeon is shown in three rivers within the area in blue and known Woodstork nesting sites are shown as yellow dots.
- This next map show current areas of protection and conservation. From numerous barrier islands, including Tybee Island, Blackbeard Island, St. Catherine's Island, Sapelo Island and Cumberland Island, to the three major areas, Ft. Stewart in the North, the Altamaha Waterfowl Management Area in the central basin and the Okeefenokee Swamp in the south, there are plenty of areas of protection.
- This last map show all of the protected areas from the previous map but also contains, in red, areas that are seen as potential expandable areas based on usage and habitat.
Past Conditions
- This first map here shows all Hurricane paths that have impacted the Georgia coast in the past 150 years. Only storms classified as a Hurricane were added. The 1881 and 1893 Hurricanes are both on the top 10 list for deadliest in the nation at 7th and 5th respectively.
- Using wind speed of the four storms, this second map, now as a raster file instead of vector, shows the wind speed, in miles per hour, for the four storms. However, where 2 hurricane paths crossed, the wind speed was added together. The wind speed was then analyzed statistically to create a probability of future strikes. Yet since storms are random, only past data can be compared to predict future storms. The higher the wind speed, the greater the damage and therefore a higher probability of future damage.
- This table shows statistical data from the previous map. This data includes only the six counties that the direct path went through. Maximum and minimum windspeed for the counties are shown along with the mean, median, mode and range of the storms.
- This last image is a map that shows a distance decay layer of the Hurricanes paths. The darker the red, the higher the probability of another storm impacting there. The white areas are where 2 or more storms crossed and therefore represent the highest probability of a reoccurring storm.
Future Possibilities
- Here, this map shows areas of low risk for future Hurricane strikes as part of the potential conservation expansion areas. The best locations for expansion are in the northern area of Fort Stewart, the mouth of the Altamaha river at the Altamaha Waterfowl Management Area and the Okeefenokee Swamp. Medium to high risk areas are shown in grey.
- This last map, shows the previous map with the areas of low risk still in green, placed behind the map of the past Hurricane paths. The areas in grey are in direct line or near the Hurricanes paths and the green areas are away from their paths.
