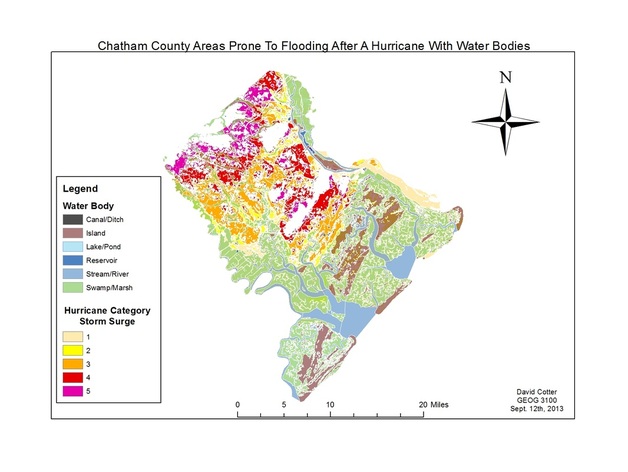
For this first assignment, we were to make a map of an area of interest that contained an issue of interest to us. I've always admired the coastal regions and ecosystems, particularly within my own state. I chose Chatham County because of it's coastal location and ecosystems. I have also been fascinated with weather and it's impact on the environment. Here I chose to look at storm surge flooding based on category of hurricane in Chatham County. As elevation increases and distance from the coast increases, a higher category hurricane is needed to cause flooding. Water bodies are also included on the map to show present water areas and levels.
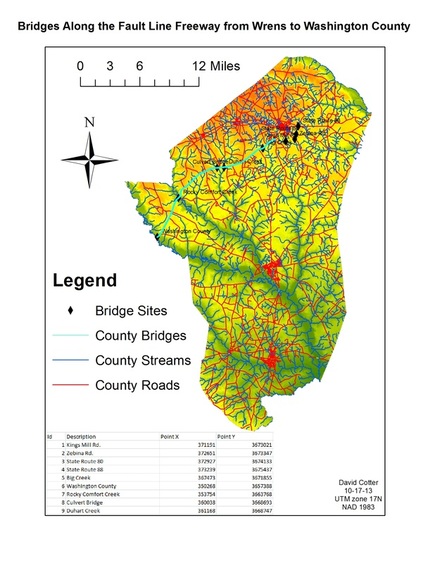
In this assignment, Jefferson County received a small fund to rebuild and repair bridges along the Fault Line Freeway from the city of Wrens to Washington county. Data was collected for 9 bridges that were in lieu of repair or rebuilding. After inputing all of the coordinates for the bridges in Jefferson County in UTM Zone 17 North, the bridges were ranked from 1 to 9 in order of which bridges needed the most work. On the map, the bridges are marked by black diamonds. The Fault Line Freeway from Wrens to Washington County is labeled as a light blue line. In addition, county roads, county streams and elevation are also included within the map.
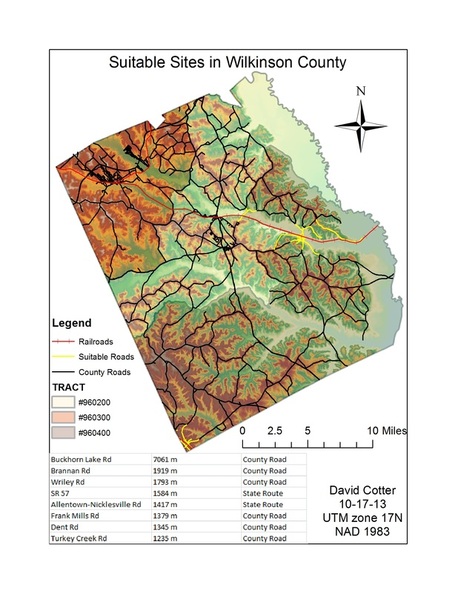
In this similar exercise, Wilkinson County was given $1.5 Million to build an Industrial Facility. The Facility was to be located within 1 km of an existing rail line and also within tract #960400. The county roads that fit the description are to be identified on the map showing potential sites for the Industrial Facility. After collecting each layer for the map, some layers had to be reprojected to all be within the same datum and coordinate system. All layers were projected to NAD 1983 and UTM Zone 17 North. Next, the roads that fit the description of being within 1 km of the railroad within tract #960400 were determined by the select by location feature within ArcMap 10. The map now shows suitable roads in yellow, railroads in red and all other roads in black. The three census tracts and elevation are also shown by shading.
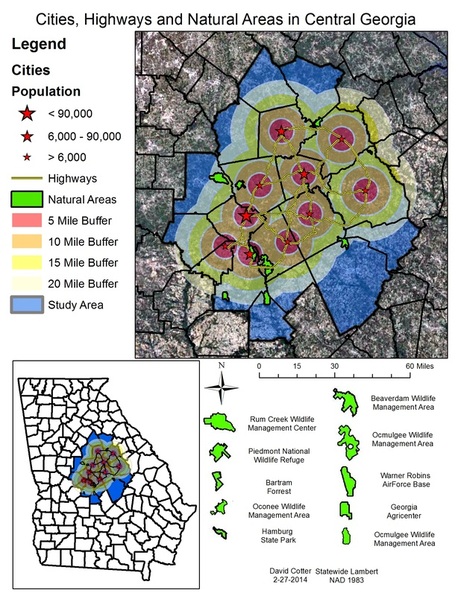
Here, using a DOT map of the state, at least 10 cities, natural areas and highways were to be made from data on the map. With this information and the DOT map available, the first thing was to digitize the cities that were going to be used. A point shapefile was created in ArcCatalog and added to the map to be edited. Ten cities were then added to the shapefile. Population of the cities was also determined. Next a polyline shapefile was created to digitize roads. The roads added were all connected to the 10 cities showing shortest distance between the cities by roadway. Next a polygon shapefile was added and 10 Natural Areas were digitized. Lastly, a multi-ring buffer was added at 5 mile intervals to show the Natural Areas distance from the nearest cities located on the map.
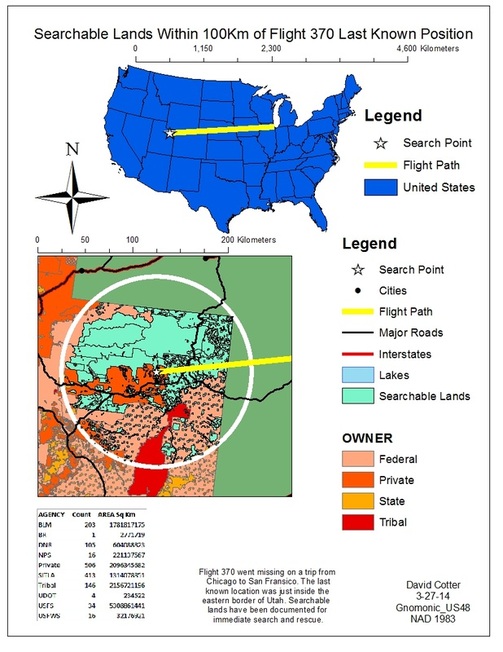
In this exercise, Flight 370 from Chicago to San Francisco had gone missing. The last time the flight had appeared on radar was 2 hours and 15 minutes into the flight. The Governor of Utah needs to be able to tell people that he is on top of the situation and needs to know what state, federal and tribal agencies to contact so the areas can be searched. After determining where the plane went down, government lands within 100 km of the site needed to be identified to know where to search for Flight 370. First, a flight path was made from Chicago to San Francisco. Next, doing basic math based on the planes speed and time of disappearance, the search location was determined. Then, types of land were gathered from Utah's Automated Geographic Reference Center. A buffer of 100 km from the search point was then added and searchable lands within the buffer were colored a sea green color. Lastly, a table was added that contained agencies to help search along with a count and area in square kilometers.
